


Results
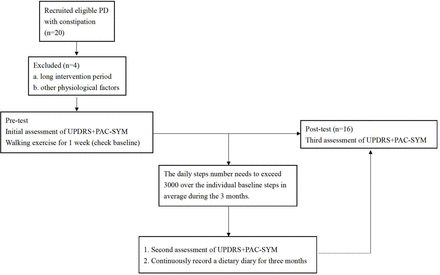
All 16 patients stayed on until the final postintervention assessment and were cooperative throughout, and no adverse reactions were observed either during or after the intervention. Of the 16 participants, 4 achieved fewer than 3000 steps.
Daily walking significantly improved constipation symptoms and PD severity across multiple domains (table 2).
Pairwise comparisons of PAC-SYM and PD UPDRS before, during and after walking exercise intervention
For the PAC-SYM total score, significant reductions were observed between times 1 and 2 (MD=4.38, 95% CI (1.98 to 6.77), p=0.001, d=1.23, large) and between times 1 and 3 (MD=3.19, 95% CI (0.22 to 6.15), p=0.033, d=0.73, moderate to large) (figure 2A).
Effect of walking exercise on Patient Assessment of Constipation Symptoms (PAC-SYM). (A) Total score, (B) abdominal symptom scores, (C) rectal symptom scores and (D) stool symptom scores. ***p<0.001, **p<0.01 and *p<0.05; values analysed using repeated-measures ANOVA with Bonferroni-adjusted pairwise comparisons (two-tailed). Data are presented as mean±SD. PAC-SYM, Patient Assessment of Constipation Symptom.
Among the PAC-SYM subscales, improvements were evident in abdominal (1 vs 2: MD=0.81, 95% CI (0.20 to 1.43), p=0.008, d=0.89) (figure 2B), rectal (1 vs 2: MD=1.00, 95% CI (0.30 to 1.70), p=0.005, d=0.97; 1 vs 3: MD=0.63, 95% CI (0.08 to 1.17), p=0.022, d=0.77) (figure 2C) and stool (1 vs 2: MD=2.94, 95% CI (1.16 to 4.72), p=0.001, d=1.11; 1 vs 3: MD=2.69, 95% CI (0.37 to 5.00), p=0.021, d=0.78) symptoms (figure 2D).
Similarly, UPDRS total scores decreased significantly from time 1 to both times 2 (MD=7.13, 95% CI (2.42 to 11.84), p=0.003, d=1.02) and 3 (MD=6.88, 95% CI (1.76 to 11.99), p=0.008, d=0.91) (figure 3A). Subscale analyses showed improvements in UPDRS parts I (1 vs 2: MD=1.44, 95% CI (0.66 to 2.21), p<0.001, d=1.25) (figure 3B) and II (1 vs 2: MD=1.75, 95% CI (0.61 to 2.89), p=0.003, d=1.03) (figure 3C), with trends in part III (1 vs 3: MD=4.06, 95% CI (0.47 to 7.66), p=0.025, d=0.76) (figure 3D).
Effect of walking intervention on the Unified Parkinson’s Disease Rating Scale (UPDRS). (A) Total score, (B) part I scores, (C) part II scores and (D) part III scores. ***p<0.001, **p<0.01 and *p<0.05; values analysed using repeated-measures ANOVA with Bonferroni-adjusted pairwise comparisons (two-tailed). Data are presented as mean±SD.
Overall, the effect sizes ranged from moderate to large, indicating that the walking exercise programme produced not only significant improvements in constipation symptoms and motor/non-motor outcomes among patients with PD and constipation but also clinically meaningful benefits.
Correlation analyses showed a strong and statistically significant relationship between increased daily step counts and improved constipation symptoms at T2 (ρ=0.996, p=0.001) (figure 4A). A positive but non-significant trend was observed for constipation symptoms at T3 (ρ=0.667, p=0.117) (figure 4B). Similarly, step counts were positively correlated with reduced UPDRS severity at T2 (ρ=0.837, p=0.056) (figure 4C), and a significant association was found at T3 (ρ=0.866, p=0.046) (figure 4D). These findings collectively highlight a potential link between increased physical activity and motor and non-motor symptom relief in patients with PD.
Correlations between changes (Δ) in daily step counts and clinical outcomes. (A) ΔStep counts versus Δconstipation (T2–T1), (B) Δstep counts versus Δconstipation (T3–T1), (C) Δsteps counts versus ΔUPDRS (T2–T1), and (D) Δsteps counts vs ΔUPDRS (T3–T1). p=0.996, p=0.001; p=0.667, p=0.117; p=0.837, p=0.056; p=0.866, p=0.046, respectively. All analyses were performed using Spearman’s rank correlation. Δ indicates the difference between postintervention and baseline scores. UPDRS, Unified Parkinson’s Disease Rating Scale.
Regarding the dietary diary, daily intake of fibre and water was analysed, and no significant differences were found during the intervention. These results are presented in online supplemental table 1 and online supplemental figure 1.
